Monitoring
Introduction
The Monitor section of the Control Center helps you keep track of the status of your deployed Flows and your Nodes. There are four sub-pages that serves different purposes:
Overview - As the name suggests this page gives you an overview of the status of both your Flows and Nodes. Flows with errors will be highlighted so that you can quickly steer your attention to where it’s most needed.
Flows - This page lists all your deployed Flows and their status. From here you can also take actions to resolve issues, like syncing Flows after parameter updates, or resetting error counters.
Nodes - Similar to the Flows page but this time showing your Nodes.
Events - On this page you find all events reported from Flows and Nodes, but also what users have been doing in the Control Center.
Note: The functionality described below assumes your Nodes run version 3.1 or higher. With older versions some features may be missing.
Overview page
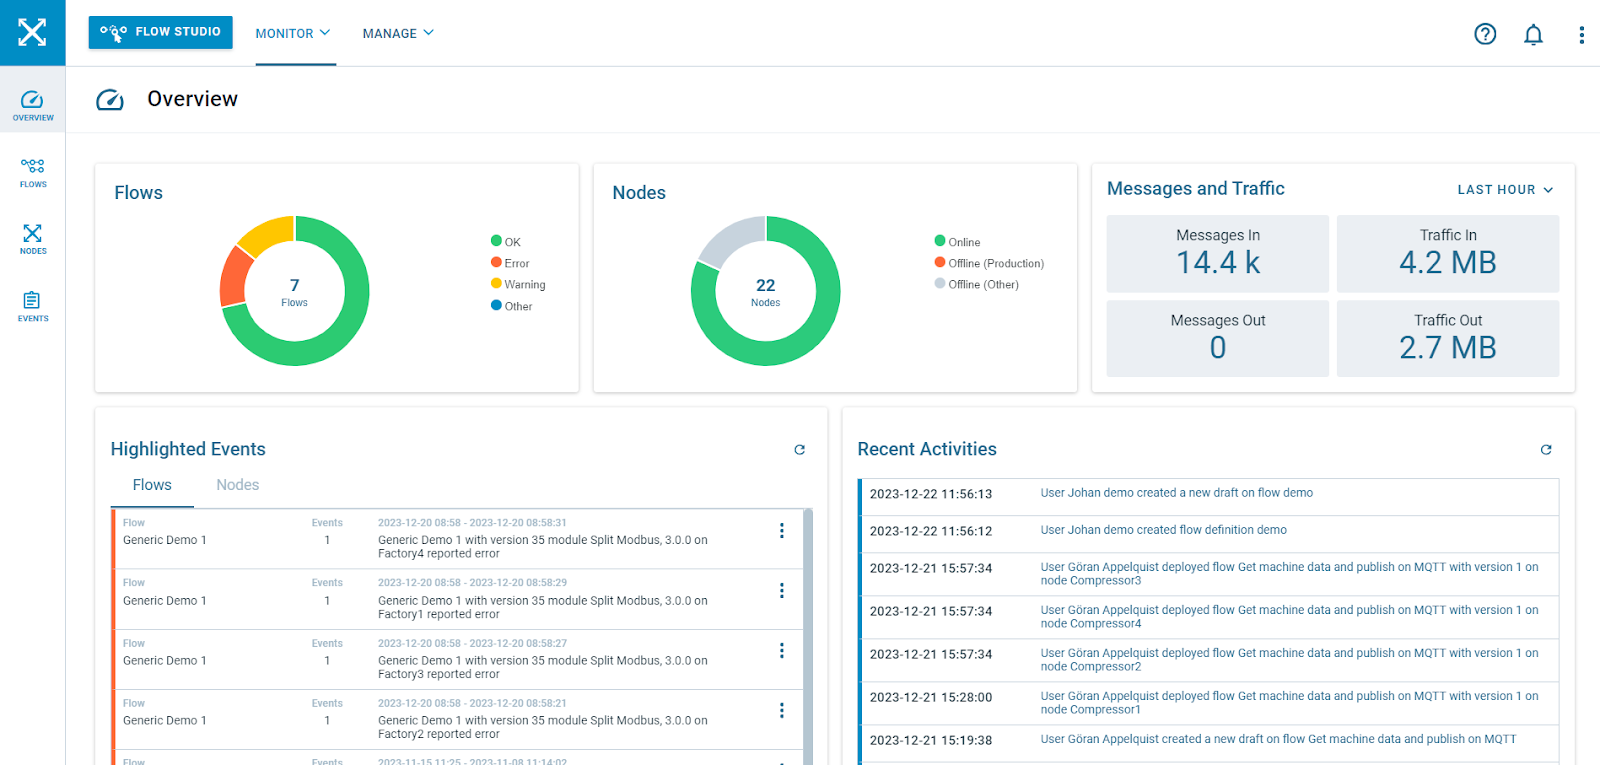
The Overview page shows the current status of all your deployed Flows and your Nodes, using two doughnut charts. Anything not green may need your attention. By clicking on a section in the doughnut charts you will jump directly to the Flows or Nodes pages with the relevant filters applied.
The Messages and Traffic panel shows a summary of the traffic through all your Flows.
At the bottom of the page there are two lists:
Highlighted Events - Shows recent error events reported from your deployed Flows or Nodes (switch tab). You can get more information about an event by clicking on it, or use the menu to the right (3 dots). When multiple events with the same information are received they will be grouped into a single event in this list. The number of grouped events are shown in the Events column and the timespan covered by the events is shown above the event message.
Recent Activities - Shows recent activities performed by users in the Control Center, like deploying a new version of a Flow, or creating a new draft.
Flows page
The Flows page gives you detailed information about your deployed Flows. Each deployed Flow is treated as a separate entity on this page. That is, if you have deployed the same Flow on three different Nodes, it will show up as three deployments on this page.
Flow State and Status
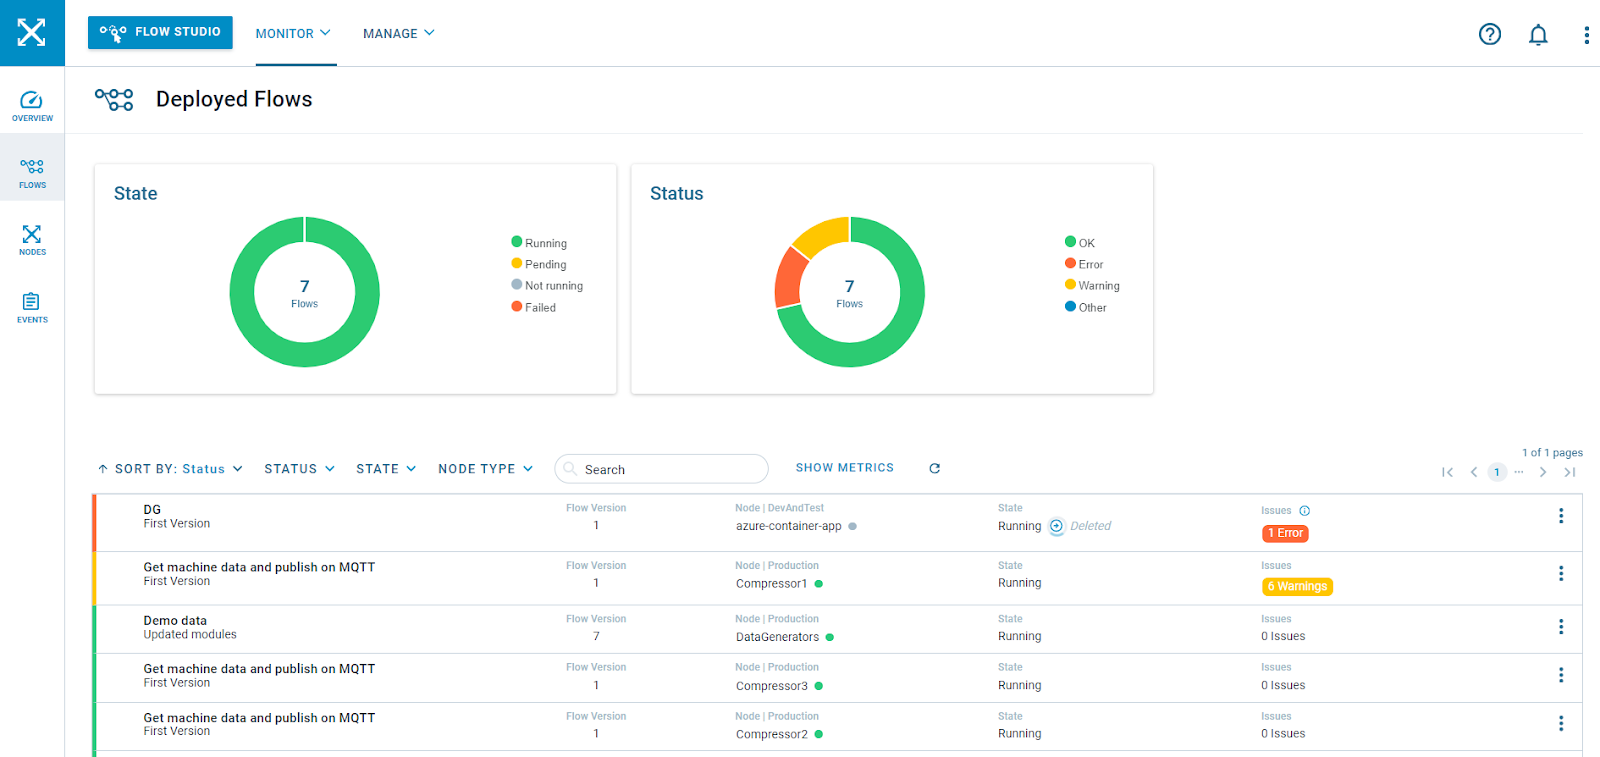
At the top there are two doughnut charts showing the State and Status of your Flows:
Flow State - The state can be one of:
Running - The Flow is running.
Pending - The Flow is about to change state, e.g. when you deploy a Flow it will take some time until the Node has downloaded and started the Flow. It will then be marked as Pending until it has reached its desired state. If you take actions on Flows deployed on Nodes that are currently offline, a Flow may stay in the pending state for a long time.
Not Running - The Flow is deployed on a Node but it is currently not running, either intentionally because someone actively stopped it, or unintentionally due to some error condition. In the list of deployed Flows the current and the desired states are shown.
Failed - The deployment failed and the Flow never started.
Flow Status - The status can be one of:
Ok - The Flow has not reported any issues.
Error - A Flow has reported errors or has stopped unintentionally. The error count can be reset (see below), which will then restore the status to Ok, if no new errors occur.
Warning- A Flow has reported warnings or has stopped unintentionally. The error count can be reset (see below), which will then restore the status to Ok, if no new warnings occur.
Other - The Flow is in a transition state and has not yet reached its final state.
List of Deployed Flows
At the bottom of the page you will find a list of all your deployed Flows. The colors to the left show the current status of each Flow, to help you quickly find Flows that may need your attention. For each Flow the table shows the name of the Flow and the description from the version used, the version number, which Node the Flow is deployed on and the current state of the Flow. The final column shows any unresolved issues, see “Resolving issues” below. It is also possible to show metrics data for the Flow, see “Flow metrics” below.
Filtering and Sorting the Flow deployment list
The charts can be used to filter the list of Flow deployments, by clicking on the corresponding section or legend. These filters will override any previous filters, i.e. if you want to use the charts, start there and then add additional filters with the filter bar.
Filters can also be added using the filter bar on top of the list. It has the same State and Status filters, but here you can select multiple filters, e.g. to see all Flows with a status that is either error or warning. You can also filter the list based on what type of Node the Flows are running on, e.g. to only see Flows running on your production Nodes.
Free-text filtering on the Flow name is the final filtering option.
The list can be sorted on Flow status, Flow name and Node name. Sorting on Node names can be useful when you want to compare multiple Flows running on the same Node.
Resolving issues
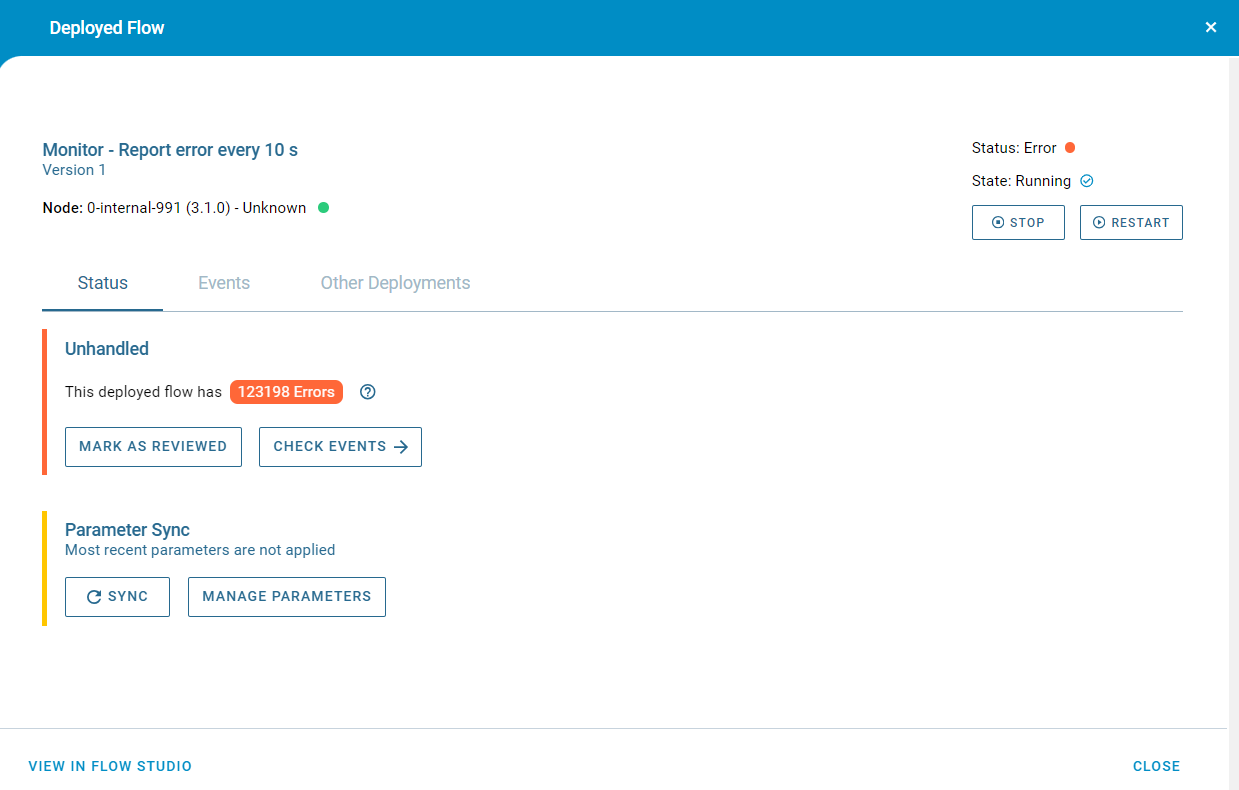
Flows can report errors and warnings to the Control Center. Sometimes these are fatal and will force the Flow to stop, but often they are temporary, e.g. a module loses connection to an external system for a while. It is still important to be aware of these issues so that you as a user can decide if some action is needed. Another situation is when a user changes the value of a parameter and this parameter is used by deployed Flows. For the parameter to take effect the Flows must be synched.
The Issues counters shown for each Flow in the list are used to cover these situations and help you find Flows that may need your attention. Whenever you see a non-zero error or warning count on a Flow you should open the Flow Details modal (click on the Flow, or use the menu). On the Issues tab it will then show you the reason for the issues. If the Flow needs to be synched to apply parameter changes, you can do it here. If there are errors or warnings reported from the Flow you can investigate them on the Events tab and when you understand the problem and have decided what, if anything, needs to be done you can clear the counters on the Issues tab.
Flow metrics
Flow metrics show you the resource usage for each Flow: CPU and memory usage, as well as number of bytes and messages in and out of your Flow over the last hour. This information is by default hidden to make the list cleaner. Click on SHOW METRICS to display metrics data. You can for example use this information to find Flows that consume excessive amounts of resources.
Updating the list
The information shown in the list is not updated automatically. To get the most recent information the list can be updated by clicking on the Refresh button.
Nodes page
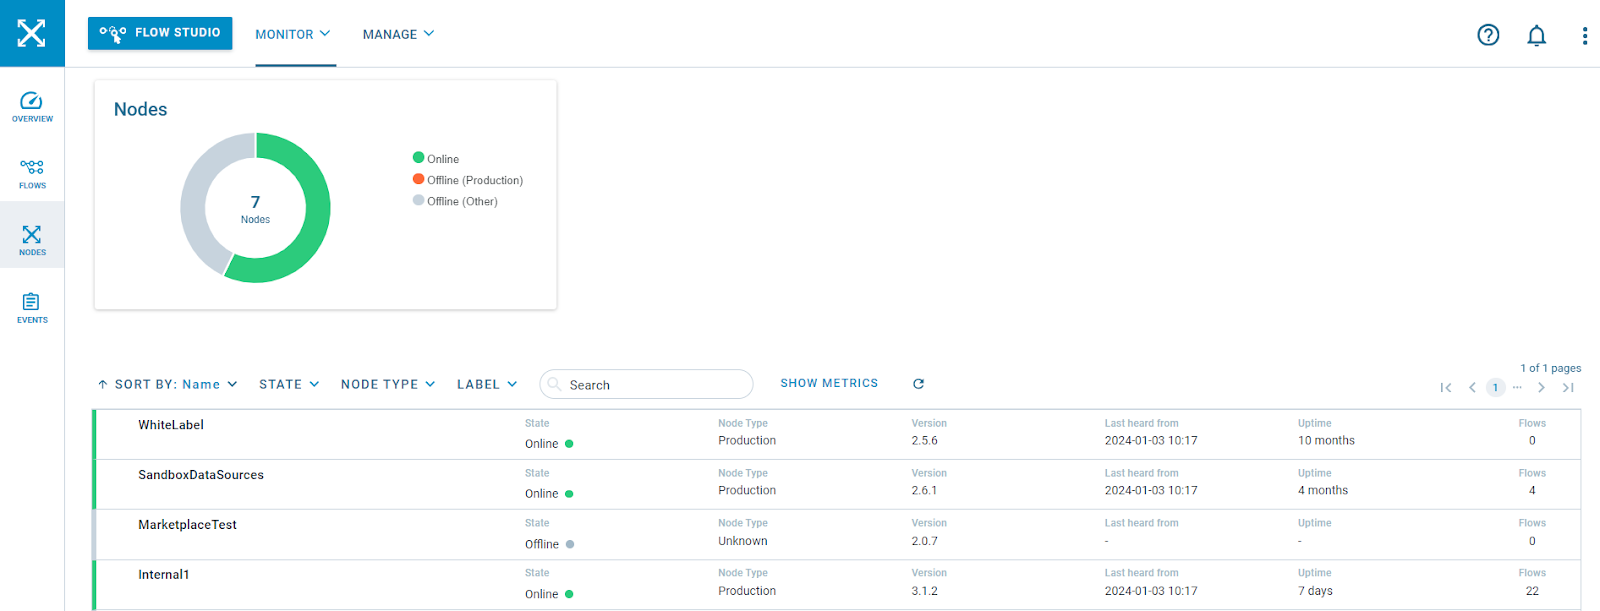
The Nodes page is similar to the Flows page, but now showing information for your Nodes. The chart at the top gives you a quick overview of the state of your Nodes, the number of online Nodes (have reported status to the Control Center recently), the number of offline production Nodes and the number of offline non-production Nodes. Also here you can click on the graph to filter the list.
List of Nodes
The list shows all your registered Nodes, with the following information for each Node:
Name - The name of the Node.
State - The current state (Online, Offline)
Type - The Node type (Production, Dev&Test, Unknown).
Version
Last Heard From - When the last status report was received.
Uptime - Time since last restart of the Node.
Flows - Number of deployed Flows.
Node metrics
Just like on the Flows page metrics data for each Node can be added to the table by clicking on the SHOW METRICS button. The metrics for the Node show the total resource usage for the whole Node, including all deployed Flows, over the last hour.
Updating the list
The information shown in the list is not updated automatically. To get the most recent information the list can be updated by clicking on the Refresh button.
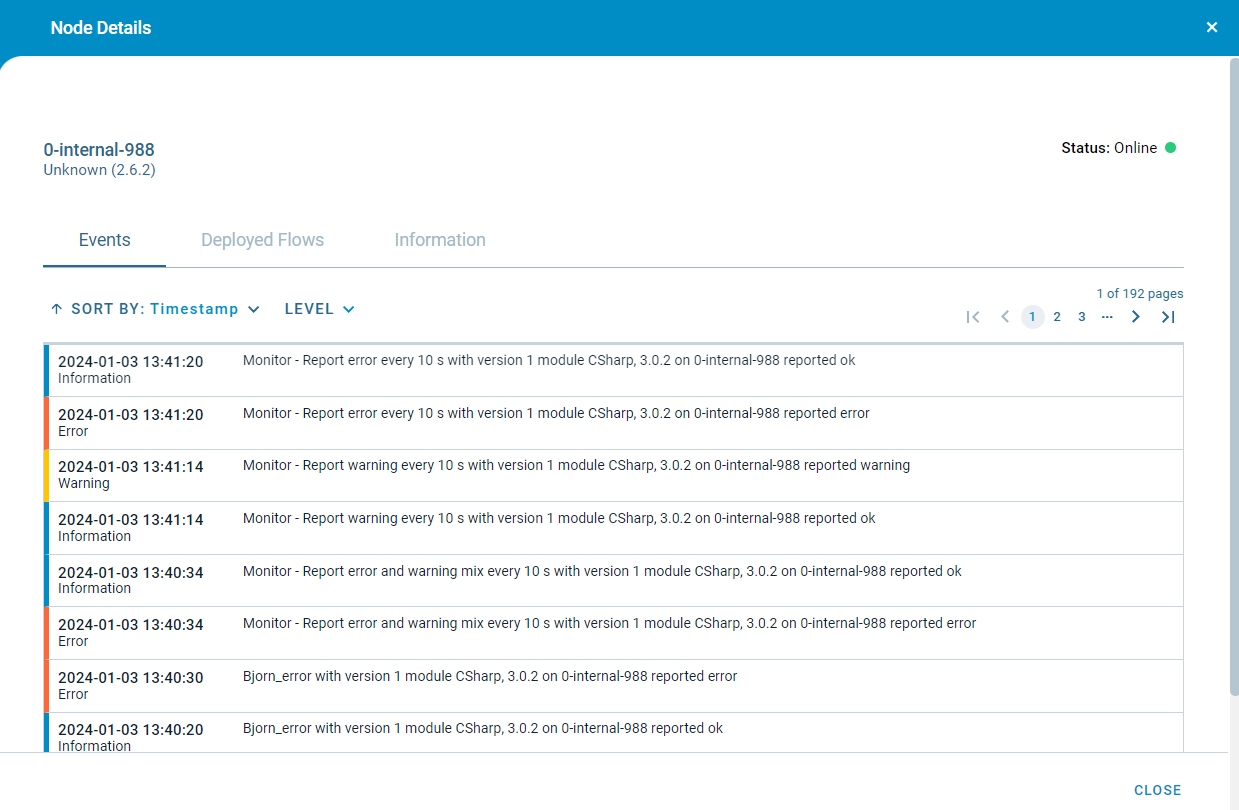
Node details
By clicking on a Node in the list, or using the menu on the right, the Node Details modal is opened. Here you can find events reported by the Node, the Flows deployed on the Node and information about the Node itself (host, labels, OS…).
Events page
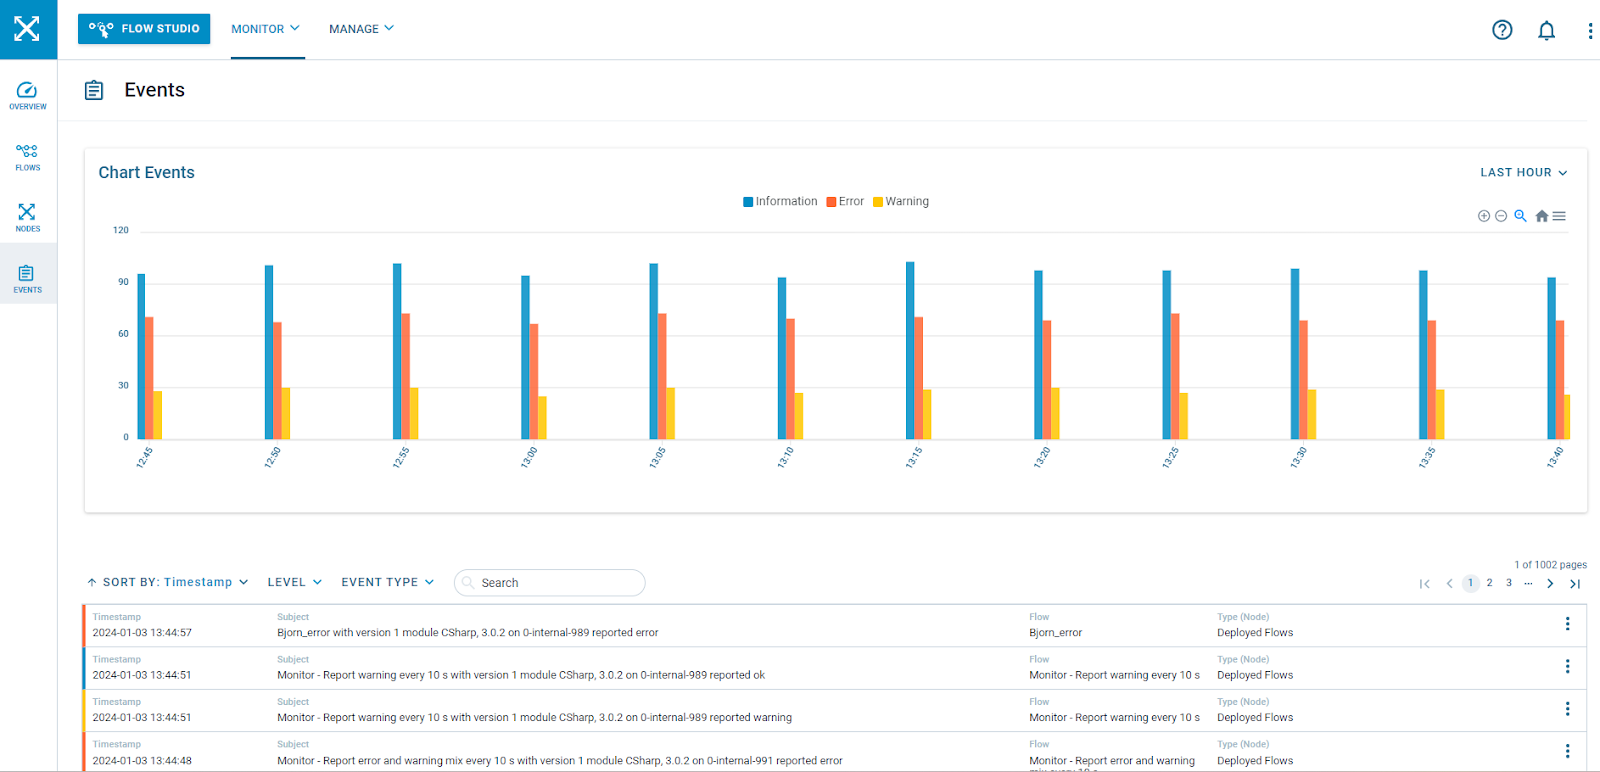
On the Events page all events reported from different parts of your system are collected: events reported from your deployed Flows and Nodes as well as events generated by user actions in the Control Center.
The graph at the top shows the number of events of each type on a timeline. The time range can be changed using the drop-down list in the upper right corner of the chart panel.
Events list
The list can be filtered on severity level as well as the type of event. By default the list is sorted on timestamps, with the most recent events first, but it can be sorted on other data using the SORT BY drop-down.
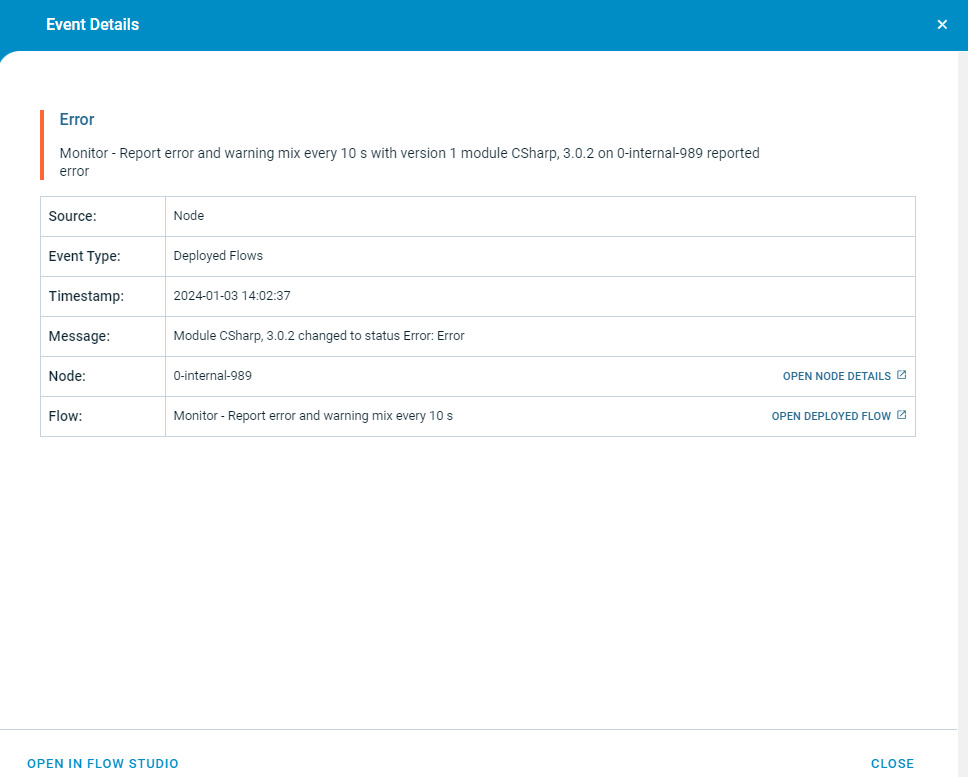
Event details
More information about an event can be found by opening the Event Details modal, either by clicking on the event or using the menu to the right. In addition to more information about the event there are also cross-references to the corresponding Flow details and Node details views, if the event is reported from a Flow. You can then also open the Flow in the Flow Studio using a direct link from here.
Related Articles
Monitoring the Crosser Node
Introduction Once you have your first flows deployed, you might think about how to integrate the Crosser Node and Flows into your existing monitoring solution. In this article we describe what options you have and how to utilize provided interfaces ...Crosser Node 2.5.0 - Major update
Crosser Node 2.5.0 - Major update October 20, 2021 New architecture This new version is primarily an internal architecture change, where flows are now even more separated by running as individual processes. This first version is designed to be ...Crosser Node as Azure Container App
Introduction Beside running the Crosser Node on a stand-alone Docker setup, or using a container orchestration system like Kubernetes/OpenShift, you can also run the Node as an Azure Container App in your Azure infrastructure. This gives you the ...Crosser Security Overview
Crosser Security Overview November 2023 About this document This document describes security aspects related to the Crosser Streaming Analytics solution. The Crosser Streaming Analytics solution The Crosser Streaming Analytics solution has two main ...